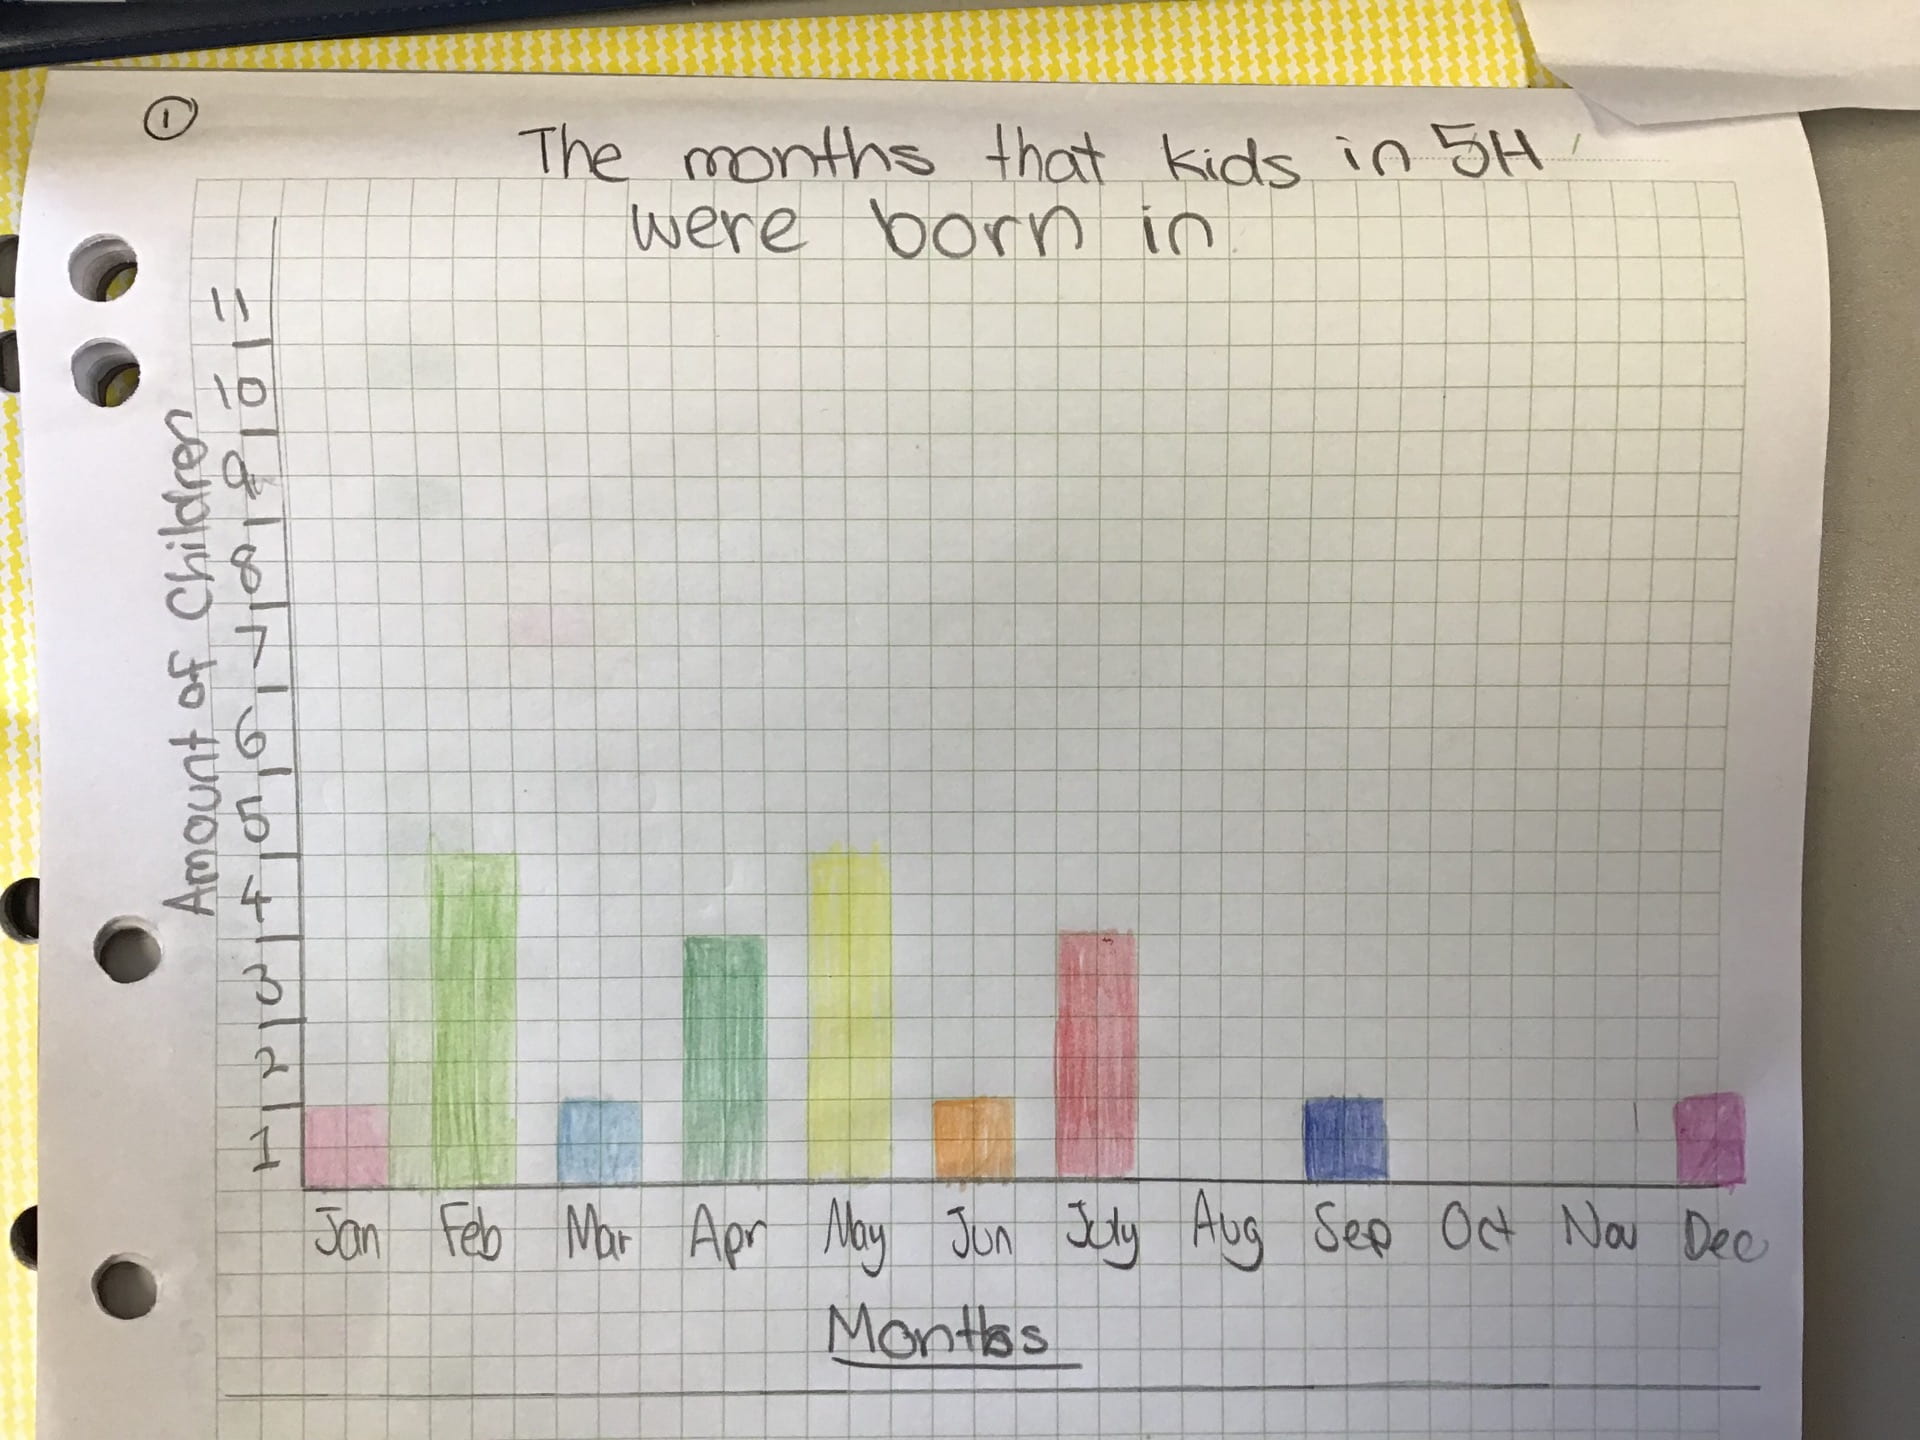
In this one, I decided to do the months that we were born in. In the Y axis I did the number of children and in the X axis the months. I went to my teacher and he asked me if I could do a bar graph of the dates; a scatter graph. I didn’t now what a scatter graph is, so I tried it.
Leave a Reply